Objective
The purpose of this dashboard is to provide a comprehensive view of the sales performance for the company, both globally and at detailed levels such as per customer, per salesperson, and per product. It aims to enhance visibility into the efficiency, profitability, and growth opportunities by tracking and analyzing key sales metrics across different dimensions. This information is crucial for ensuring that the company maximizes its revenue potential, identifies high-performing areas, and manages customer relationships and sales strategies effectively.
Try the dashboard live:
Key Performance Indicators (KPIs)
The dashboard focuses on the following KPIs to determine sales performance:
- Turnover: The total revenue generated from sales over a specific period. This figure includes all completed transactions and reflects the overall financial performance of the sales team. It can be shown over time, by customers, by salespeople and by product.
- Number of Sales: The total count of individual sales transactions completed. It gives a clear picture of the sales volume and customer activity during the reporting period.
- Quantity Ordered: The total number of items or units that customers have ordered. This metric helps assess demand levels and customer purchasing behavior.
- Quantity Delivered: The total number of items or units successfully delivered to customers. Comparing this to the quantity ordered helps track fulfillment efficiency and identify potential gaps in supply chain or inventory processes.
- Average Basket: The average value of each sales transaction. It is calculated using the formula:
Average Basket = Turnover ÷ Number of Sales
A higher average basket value indicates that customers are purchasing more or opting for higher-value items per transaction.
Dashboard Structure
The dashboard is divided into four main sections, each serving a distinct purpose:
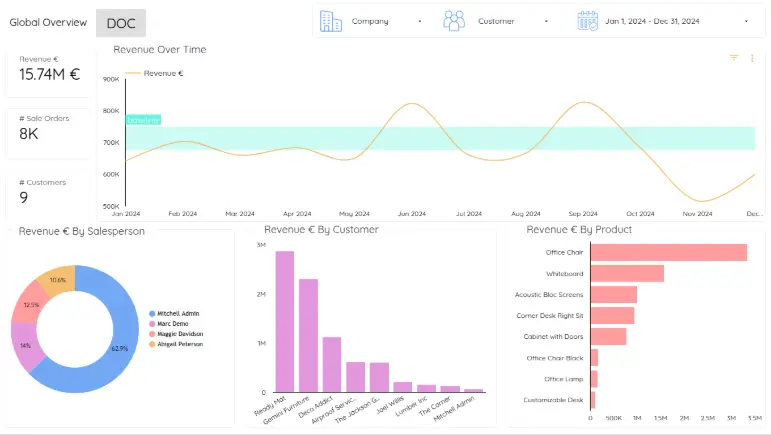
- Global Overview Section:
- This section provides a comprehensive overview of the company's revenue performance over time.
- It includes visualizations breaking down turnover by customer, product, and salesperson, allowing management to quickly grasp key trends and revenue contributors.
- The section supports strategic decision-making by highlighting top-performing products, key customers, and high-achieving sales personnel over different periods.
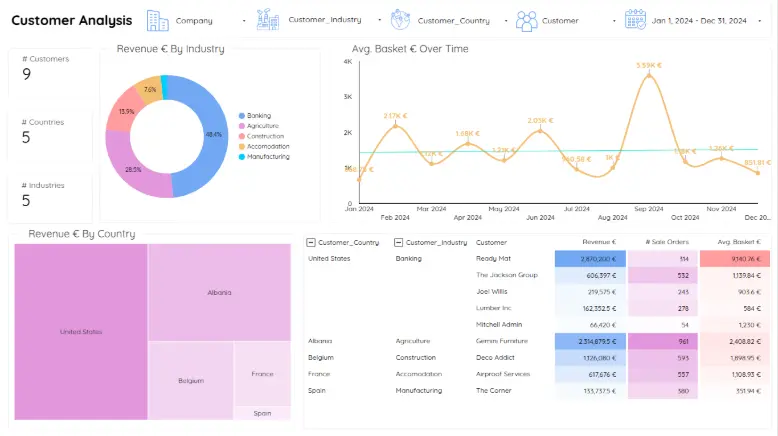
- Customer Analysis Section:
- This section focuses on analyzing customer behavior and contribution to overall sales.
- It offers detailed metrics such as turnover, number of sales, average basket value, quantity ordered, and quantity delivered by customer segment.
- By drilling down into individual customer data, management can identify loyal customers, spot potential churn, and tailor sales strategies accordingly.
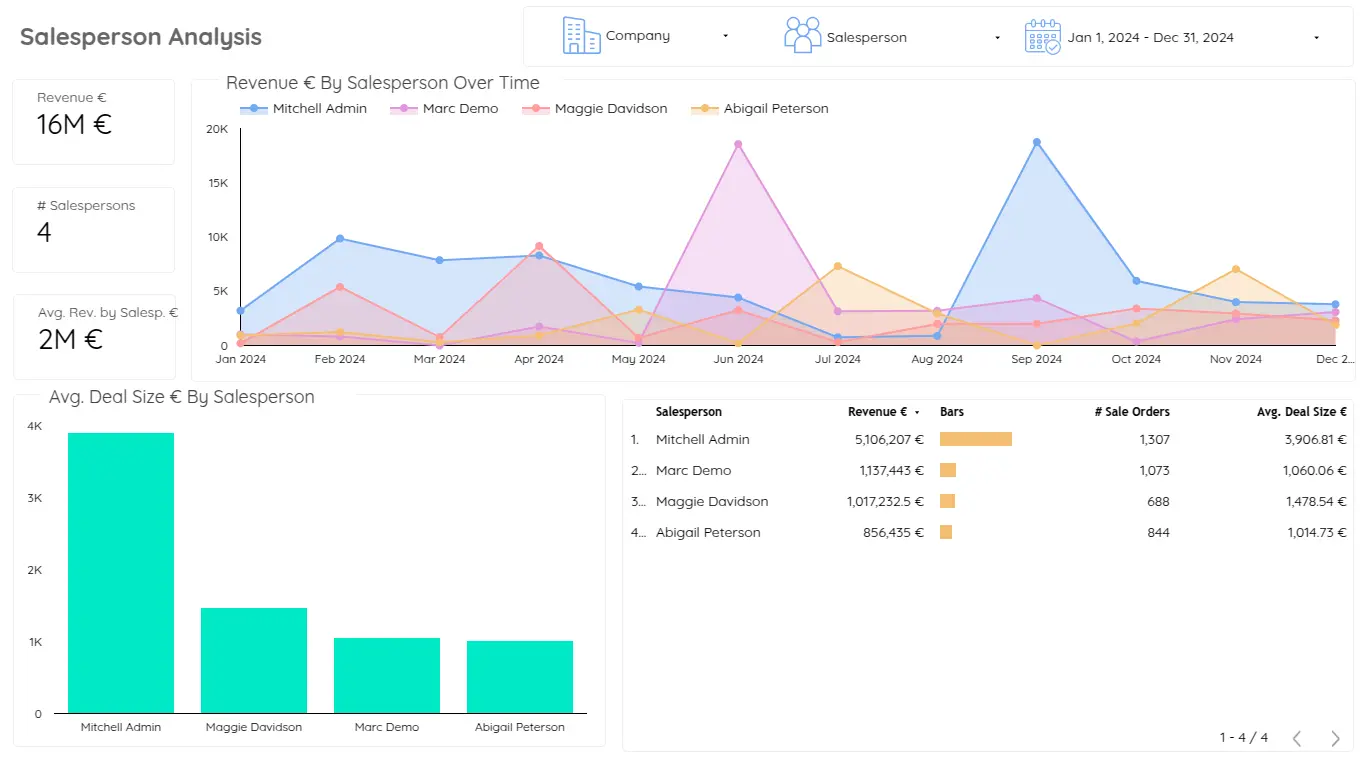
- Salesperson Analysis Section:
- Here, the emphasis is on evaluating the performance of individual salespeople.
- Key KPIs such as turnover, number of sales, and average deal size are broken down per salesperson to identify top performers and areas requiring additional support or training.
- This section helps management align sales targets and incentivize high performance.
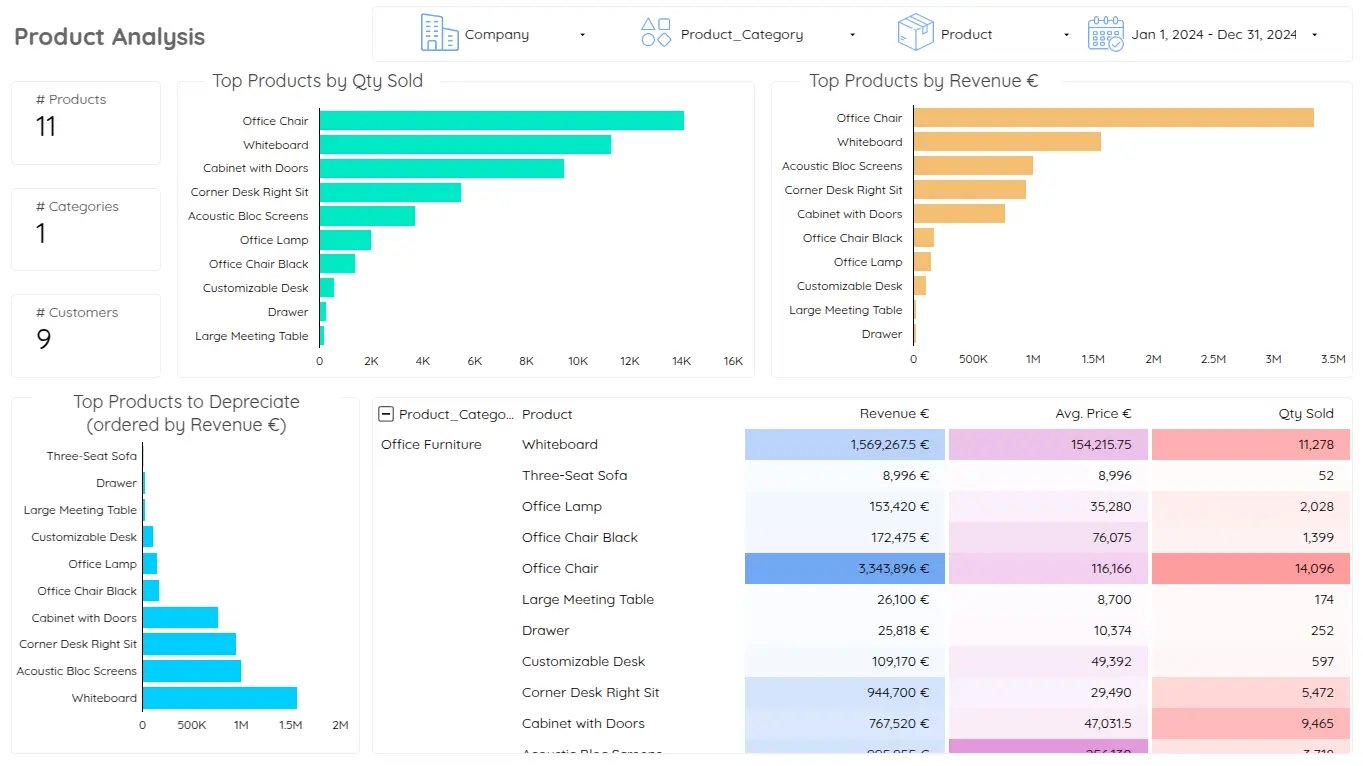
- Product Analysis Section:
- This section dissects product-level performance, highlighting key metrics such as turnover, quantity ordered, and quantity delivered for each product.
- It enables management to track best-selling products, assess stock fulfillment efficiency, and make informed decisions about inventory, pricing strategies, and product focus areas.
Benefits
- Enhanced Visibility: By centralizing and visualizing key sales KPIs, the dashboard provides a comprehensive view of company revenue, customer behavior, product performance, and salesperson effectiveness in one place.
- Improved Decision-Making: Managers can make data-driven decisions based on real-time sales data, allowing for more effective strategies in pricing, inventory management, customer targeting, and salesforce optimization.
- Focused Sales Strategies: Detailed breakdowns by customer, product, and salesperson help pinpoint high-value customers, top-performing products, and successful sales tactics, enabling the company to refine its sales approach and boost conversion rates.
- Revenue Growth Opportunities: By analyzing trends in turnover, average basket size, and fulfillment rates, the dashboard helps identify opportunities to upsell, cross-sell, or improve delivery efficiency, all contributing to increased sales and customer satisfaction.
Prerequisites
This dashboard is built based on the following Odoo prerequisites:
- Sales transactions are recorded in the Sales module (if you want to compute your turnover based on your sale orders).
- Invoices are created and managed within the Accounting module (if you want to compute your turnover based on your invoices).
- Salespersons are assigned to each sale/invoice to track individual performance.
- Customers are properly encoded and linked to sales/invoices.
- Customer industries are defined and used for segmentation analysis.
- Products are clearly defined and used in all sales transactions.
- Product categories are assigned to each product to facilitate category-level insights.
Up next
Contact us for more information: